
One of the foundational building blocks of Ridge AI’s product is Mosaic. So what is Mosaic?
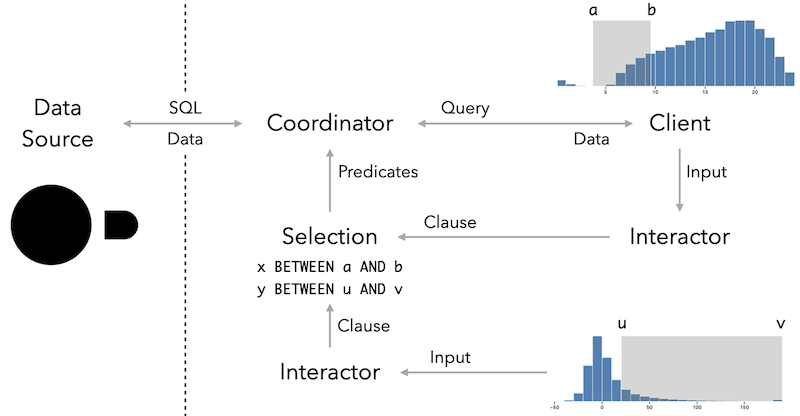
Mosaic is an architecture for greater scalability, extensibility, and interoperability of interactive data views on the web. Mosaic decouples data processing from specification logic to achieve higher performance & interactivity. Computation can run on the edge (in the browser), or on a server. Combined with automatic query optimization, this provides interactive visualizations that are much faster than legacy server-based approaches.
After decades of visualization library and language development, it’s fair if your initial reaction to Mosaic is: “huh? yet another visualization toolkit!?” However, despite the impressive ecosystem of open-source visualization tools, most still suffer from a lack of scalability and flexibility.
We believe that our tools should scale to the large datasets now common across science and industry. They should leverage modern analytical databases to manage large data volumes efficiently. They should apply specific local optimizations when chart semantics are known, and more general optimizations to reduce interactive latency.
At the same time, our tools should be flexible and interoperable, with scalability optimizations provided automatically. Linked interactions (selecting elements in one view to drive changes in another) should be supported not only between visualizations, but also across various visualization libraries. Tools should be usable within computational notebooks and on the web, with or without a backing database server.
Mosaic is our attempt to meet these goals: an architectural layer that mediates between data sources and interface components. By decoupling data processing from specification logic, Mosaic unifies scalable visualization techniques with visualization languages. Clients communicate their needs as declarative queries, while a central coordinator manages and optimizes these requests. In particular, we’re able to provide up to multiple orders-of-magnitude improvements for interactive querying of aggregated data: Mosaic recognizes aggregation patterns to compute pre-aggregated summaries that can be queried incredibly fast.
In short, Mosaic is not “just another toolkit.” It is an underlying architecture that represents a step toward a more interoperable, scalable foundation for visualization — one that bridges expressive grammars of graphics with the realities of modern data systems.
Dominik Moritz and I developed Mosaic over the last few years and have presented our research at conferences like IEEE VIS, ACM CHI, ACM SIGMOD. Mosaic is open-source and is being used by a number of companies and has more than 1,100 stars on Github. Take it for a spin at https://idl.uw.edu/mosaic.
More on Mosaic:
.png)
