Embedded Analytics on Databricks
A composable analytics layer for the lakehouse.
Ellie Fields
June 16, 2026
Why We're Building AI-Native Embedded Analytics
Announcing Ridge AI's build flow closed beta and $2.6m fundraise
Ellie Fields and Jeffrey Heer
April 5, 2026
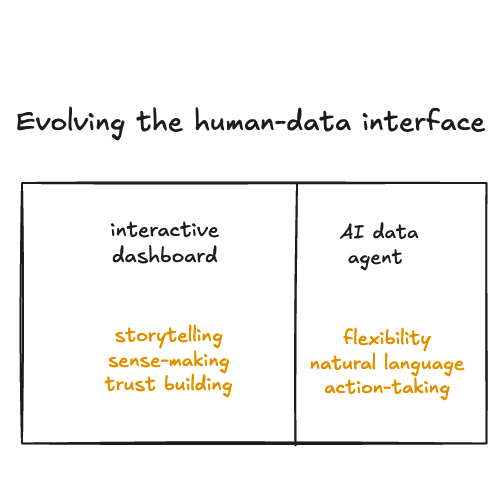
Breakthrough Interactivity in the Ridge AI Data Agent
Linking interactivity means more control with an intuitive interface.
Ellie Fields
March 17, 2026

The AI Debate Happening In Every Product Team
And the 10x rule that guides a strategic answer.
Ellie Fields
January 27, 2026
Agents Are Creating New Data Sets. Now What?
Why agentic data generation will change the downstream tool stack.
Ellie Fields
December 15, 2025

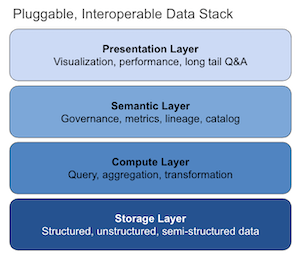
The Data Stack Moved Forward Again—Except for One Part
Thoughts on the dbt-Fivetran merger, openness and interoperability.
Ellie Fields
October 15, 2025
Mosaic Architecture
From fragmented tools to unified abstractions for scalable, interactive data applications.
Jeff Heer
September 23, 2025