
Our vision at Ridge is that analytics should be a composable layer of your data stack.
At the highest level, this means analytics should work with, rather than rebuild, other layers like storage and semantics.
It also means you can move faster with higher confidence in the results.
A story about embedded analytics
Years ago, I was the Chief Product Officer at Salesloft, a mid-sized software company. We were expanding the platform, and our value proposition was to deliver outcomes for our customers, not just activity.
Analytics were essential to proving the product's value, winning deals, and expanding within accounts.
Unfortunately, the analytics in our product at the time were mostly activity: how many calls were made, how many emails were sent, and so on. Useful, but not terribly insightful. For our buyers, typically leaders in the revenue organization, they were very boring. And for the CFOs, who had to approve purchases in the six and seven figures, they were definitely not convincing.
To prove the value we were delivering, we needed to tell our value story in a better way. We needed data that was visual, interactive, and customized to each customer. This meant greatly expanding and leveling-up the analytics that were available in our product.
We brought in Databricks in part to power our entire data stack, including our customer-facing analytics. It was a great system and the right choice for us.
But there were three problems:
Performance
The first problem was performance. To get the performance we needed for in-app interactivity, we had to buy another product as an acceleration layer. That acceleration layer was six figures, on top of the quite substantial purchase of Databricks we'd already made. Whenever we did anything trivial, like add a filter to a dashboard, our team had to re-optimize the acceleration layer, and sometimes the underlying data, which would take from days to a week.
Sloooooooooooooow.
Build or buy?
The second problem was that we had to choose a front-end framework for the analytics. Either build or buy one. All the options to buy were more six-figure options, and not quite fit for purpose. Even my alma mater, Tableau, couldn’t deliver the performance we needed at a reasonable price. And while it’s still a great exploratory tool, the learning curve can be quite high. We chose a framework that let our developers custom build our dashboards.
Guess what? Building them out was also slooooooooooooow. It also takes expertise in data design, interactivity, and visual best practice. The lack of that expertise guiding the design is one of the main problems I see in vibe-coded dashboards today.
Always more questions
The third problem was that every question led to another question for our customers. In a way, that was great-- it meant they were engaging with our product! But when the only answer is yet another dashboard, you get in a bad cycle quickly.
This story has a happy ending. The Salesloft team was great. They pushed through those problems and solved them. But it took us over a year of developing a number of specialized skill sets across several teams before we could deliver anything for our customers.
That brings us to Ridge AI.
When Jeff and I started Ridge AI, we knew that in-browser performance, lowering the learning curve with AI, and a Data Agent that answers questions were going to be critical for our customers.
Browser-based computation is much faster. And cheaper.
In particular, bringing computation into the browser made it unnecessary to get queries executed quickly (at high expense) in a data warehouse or acceleration layer. While Databricks is a great platform, it’s still not fast enough to serve analytics interactively in a way that feels fluid to users. Its main job is to centralize storage, semantics, and transforms, so your data is always joined the correct way – not that way someone guessed at it when building analytics.
Taking advantage of the compute power of local devices with browser-based technologies like DuckDB, WebAssembly, and now the Mosaic open source library allow us to provide interactivity in milliseconds, not multiple seconds. This is in line with what users expect of web-based experiences and great products.
Composability is essential for a modern data stack.
We also were convinced that Ridge must be composable. It has to work with your data stack easily. This lets you ensure that centralized definitions, transformations and governance are enforced. And it lets you get started quickly.
You don't need to re-create your data stack to ship killer embedded analytics. It should fit right in.
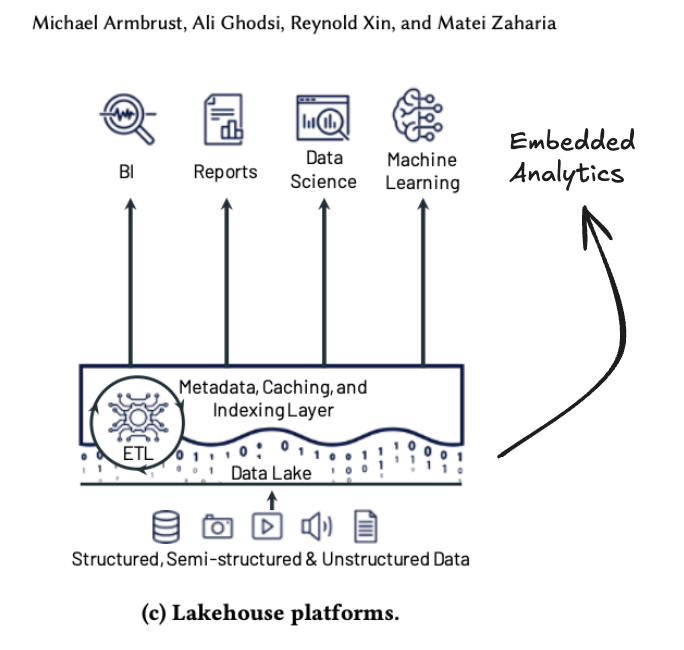
If that sounds familiar, this is also the Lakebase vision: centralized metadata and storage layers that workloads such as BI can leverage. In short, you can expose data for different workflows, while having confidence that it is correct.
Databricks is fantastic– at some things.
Databricks customers, especially those that have tried Lakebase and Genie for in-product analytics, may have found similar issues. You may want to consider a composable, browser-centric approach that fits with your Databricks implementation.
Databricks is a fantastic set of products. I'm glad we made the choice to be a customer way back then. But I wish there had been a better way to deliver all that power directly to our customers in our app. So we're building it.
