.avif)
Ridges, data, pricing, and the rest. Find answers here.
At the highest level, you connect to a data set, build a Ridge, Explore it, then embed it in your product or on the web for your users to explore.
You don't need to know a lot about how to work with data. You only need to know what business questions you want to ask.
Ridge's agents help you at each step:

While LLMs will build you a dashboard, they might not build one that answers your question. And if they do, you next have to worry about:
And should you get all of that right, you next need to think about deployment:
If you're worrying about all of that, you're likely not spending enough time on your core product. The opportunity cost of taking on all these problems at once is lost time and focus.

Plans are priced per Ridge:
All plans include the Build, Data, and Transform Agents. For full details and custom enterprise options, see our pricing page.
A Ridge is one embedded dashboard with a paired Data Agent — a single use case. Pricing per Ridge keeps costs predictable and aligned with the value you get, rather than tying them to seats, queries, or compute, which lead to unpredictable bills. It's easy to start with one Ridge and expand as you add use cases. See the full breakdown on our pricing page.
Ridge's browser-based architecture is a paradigm shift away from traditional, server-side BI tools like Tableau or Looker. Instead of querying a server every time a user interacts with a chart, the computation happens locally, in the user's browser.
How it works: Ridge connects to your backend database, lightly caches the data it needs (partitioned by customer), and injects that specific chunk of data — along with a declarative dashboard specification — directly into the user's browser. This is made possible by modern web technologies like WebAssembly (WASM) and DuckDB, which let a single-node database run inside the browser. The stack is coordinated by Mosaic, an open-source visualization library designed to push large amounts of data into the browser efficiently.
Why it matters:
Mosaic is the open-source foundation that makes Ridge's browser-based architecture extremely fast. It's an architecture for running interactive data views on the web at scale — it connects visualizations directly to analytical databases (in the browser or on a server) and coordinates them so they share data and stay in sync. The result is that even large datasets stay fast and responsive, with linked filtering across charts.
Mosaic was created by Jeff Heer (Ridge co-founder) and Dominik Moritz. You can learn more on the Mosaic project site or GitHub. For a deeper look, see our blog post, Mosaic Architecture.
A Ridge is a data experience consisting of one dashboard and a paired Data Agent that work together for a single use case (such as sales or usage data). A Ridge is backed by a single Dataset.
The paired structure of the Ridge combines two distinct functions: The Dashboard provides visual sense-making, giving users a high-level understanding of the data's shape and key metrics. The Data Agent acts as a natural language exploration tool, allowing users to ask free-form follow-up questions and solve the long tail of specific queries that aren't explicitly visualized on the dashboard. Linked interactivity means that either can respond to filters or selections in the other, extending the exploratory power of both the dashboard and Data Agent.
By bundling these two elements into a single instance, businesses can quickly give their customers both structured insights and the freedom to independently explore data. This also solves the dashboard proliferation problem of traditional BI tools, where a new dashboard must be built to answer every single customer request.
In addition, by constraining the Data Agent to only the dataset backing that specific dashboard, the quality of results is better because it's more focused. You can be sure that the data the customer sees is correct and relevant, rather than exposing all your data.

To build a Ridge, click "Add Ridge" on the Home screen or Ridges page. The Build Agent will walk you through the process of building. See the help video above for a detailed walkthrough.
If you want custom theming, set that before you begin in "Theme" on the left hand nav.

If you have the Editor role, you can edit your dashboard or regenerate a new one:
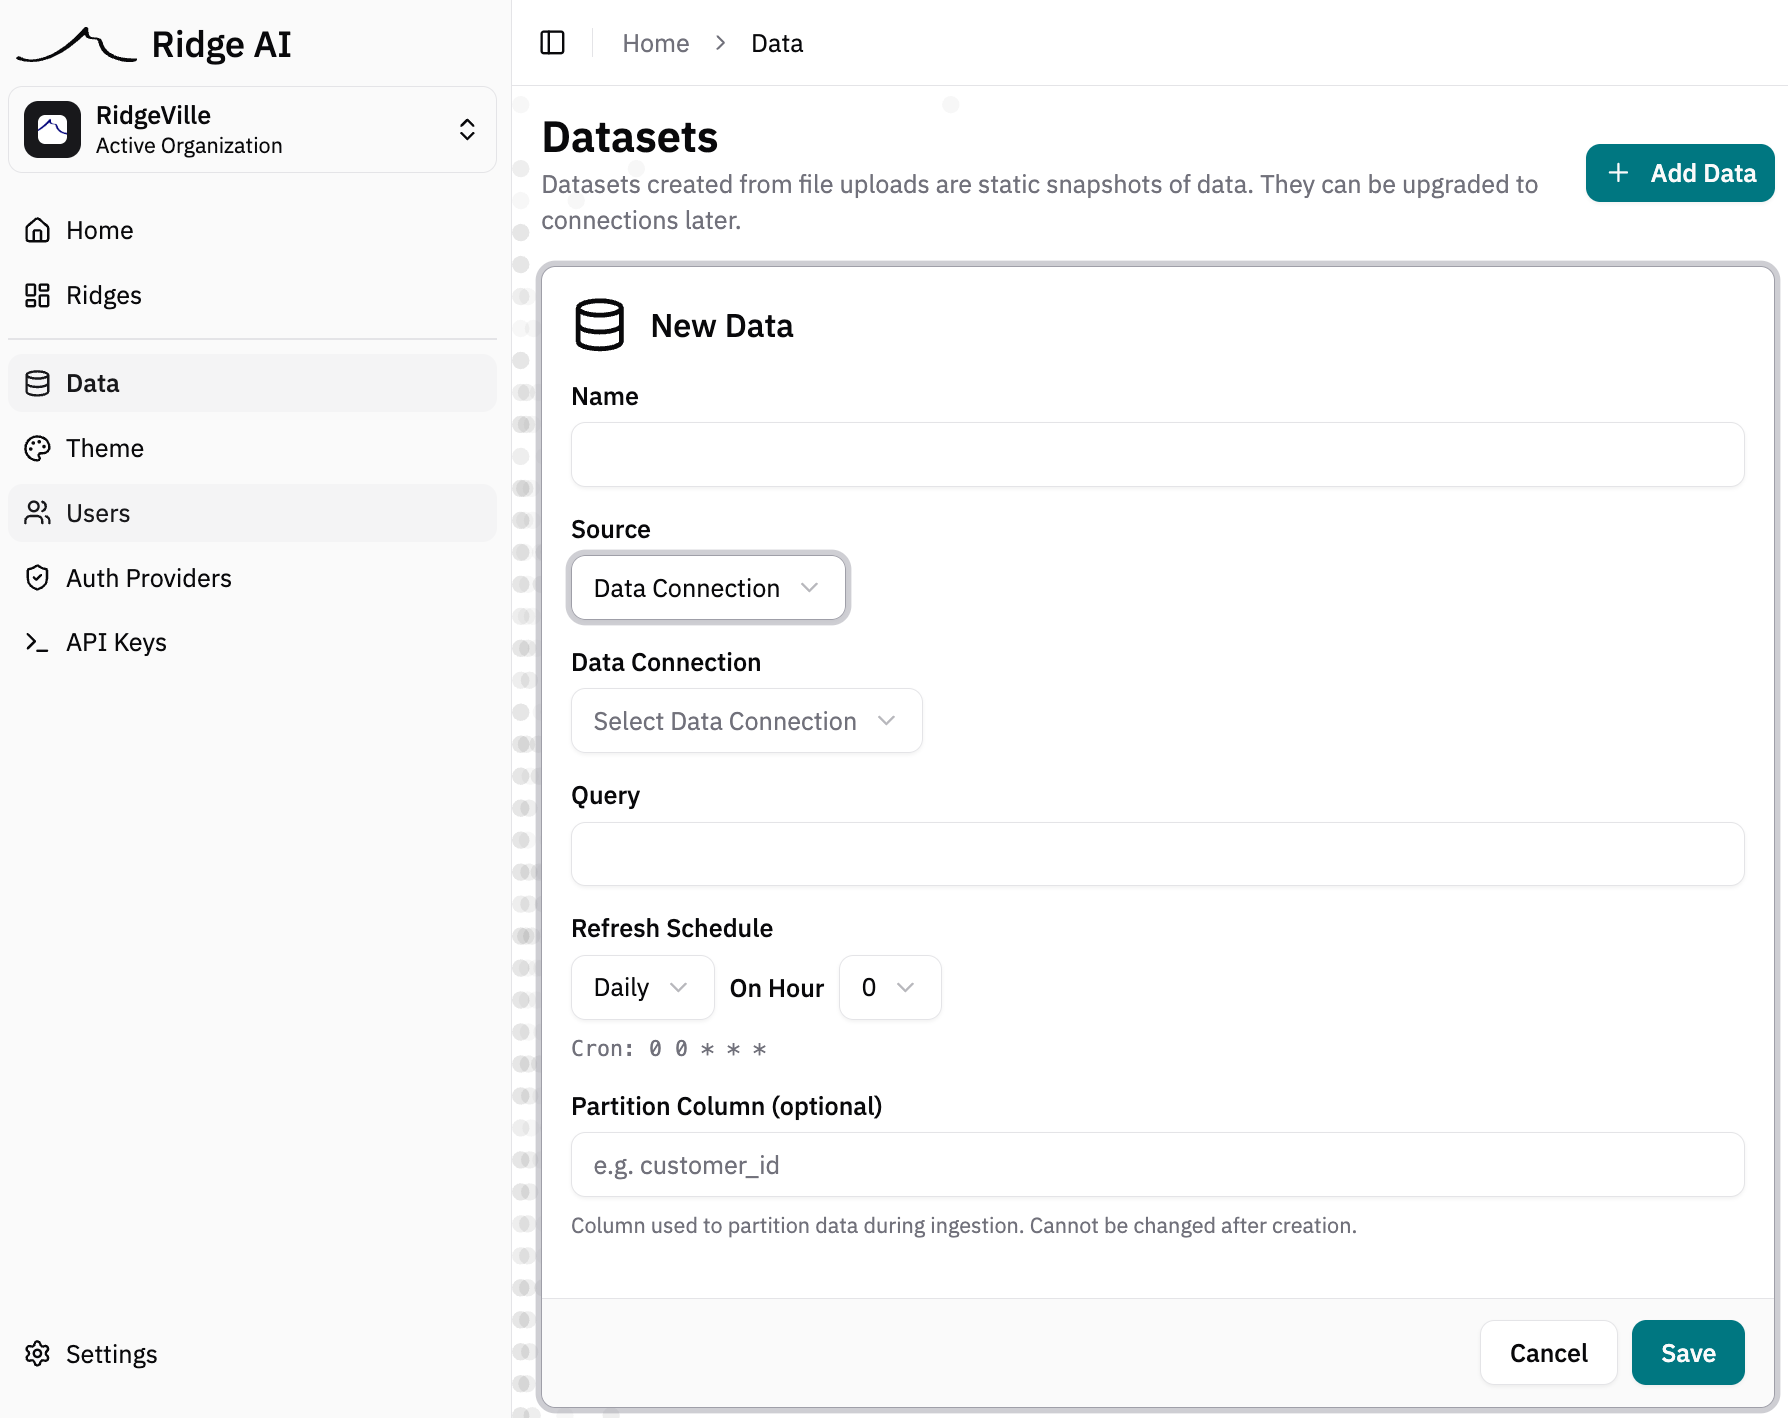
Set the refresh schedule in the Dataset.
Refresh is available for Datasets with Data Connections only, not uploads.
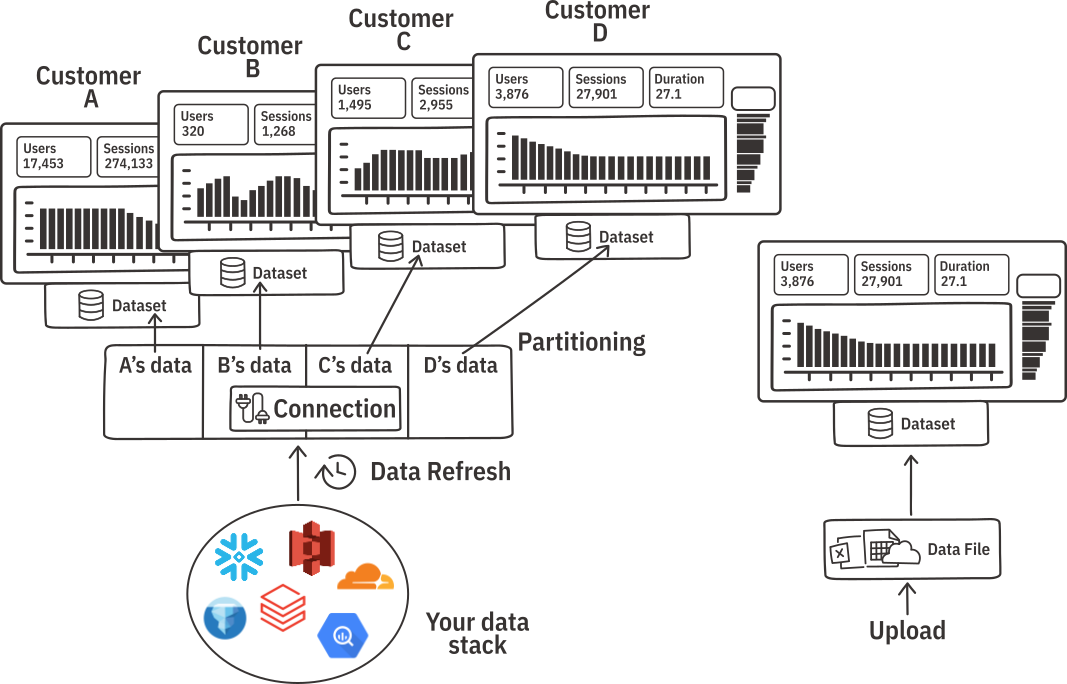
Partitioning supports customer separation in your data, similar to multi-tenancy: Partitioning ensures that end-users only have access to their own specific data. This guarantees that "Customer A" only sees their own data and "Customer B" only sees their own data, even though they are on the same embedded dashboard.
When a user accesses the embedded dashboard, Ridge AI injects only their specific, partitioned chunk of data directly into their web browser. This ensures that the data is completely secure and sandboxed, while allowing the dashboard to maintain sub-second browser-based performance.
Set the Partition Column in the Dataset.
Keep in mind:
Ridge supports enterprise data sources including
They are related:
Only Datasets that come from Data Connections (not files) can be refreshed or partitioned.
Ridge is designed to sit on top of your existing data stack, not replace it. We think your data semantics are better centralized across your data stack, rather than locked up in dashboards. This is a major philosophical change from the last generation of tools.
Ridge is a pluggable, interoperable data presentation layer. We're focused on improving the human-data interface. By specializing in data presentation, we can do it better than if we tried to do everything.

Yes, during the browser session.
Here's how it works: When a user access a Ridge, the data is brought into a user's browser. When the user closes the browser window, the data is deleted by default. On subsequent loads, data will have to be re-downloaded to the browser. There shouldn't be an effect for a user who loads, interacts, and leaves, if they don't return for a subsequent session.
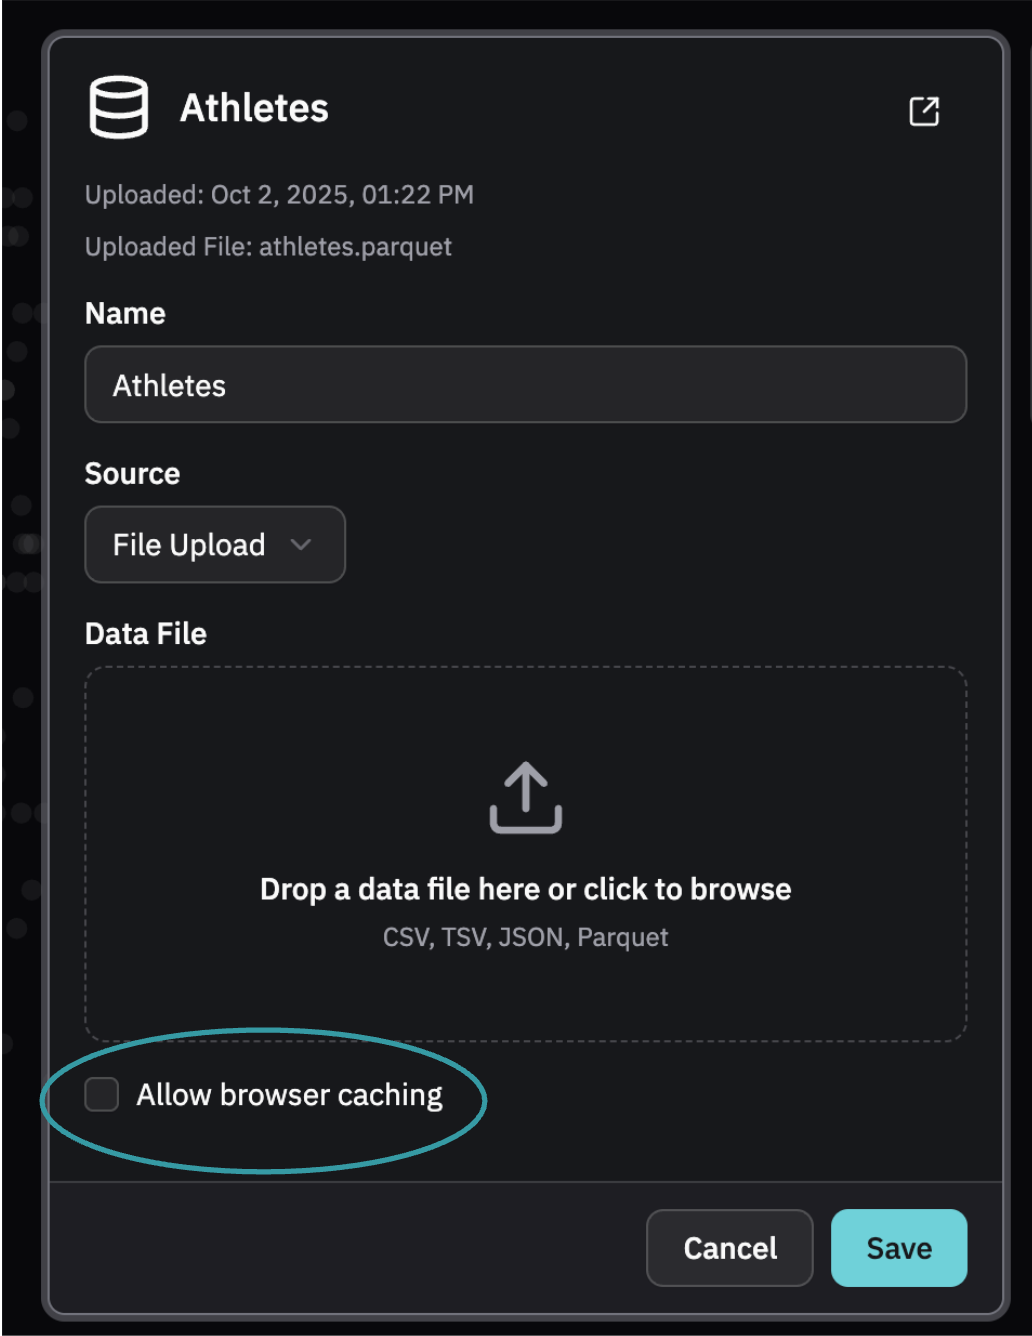
There is a setting on the Dataset to allow users to cache it locally if they prefer. This will speed up subsequent loads of the data.
When you embed a Ridge in your site, the flow for end users looks like this:
Navigate to "Theme" on the left-hand navigation in the Ridge app. Then either
Once set, the custom colors will be used in new dashboard builds and Data Agent sessions.
Resetting will reset the palette to the default colors.

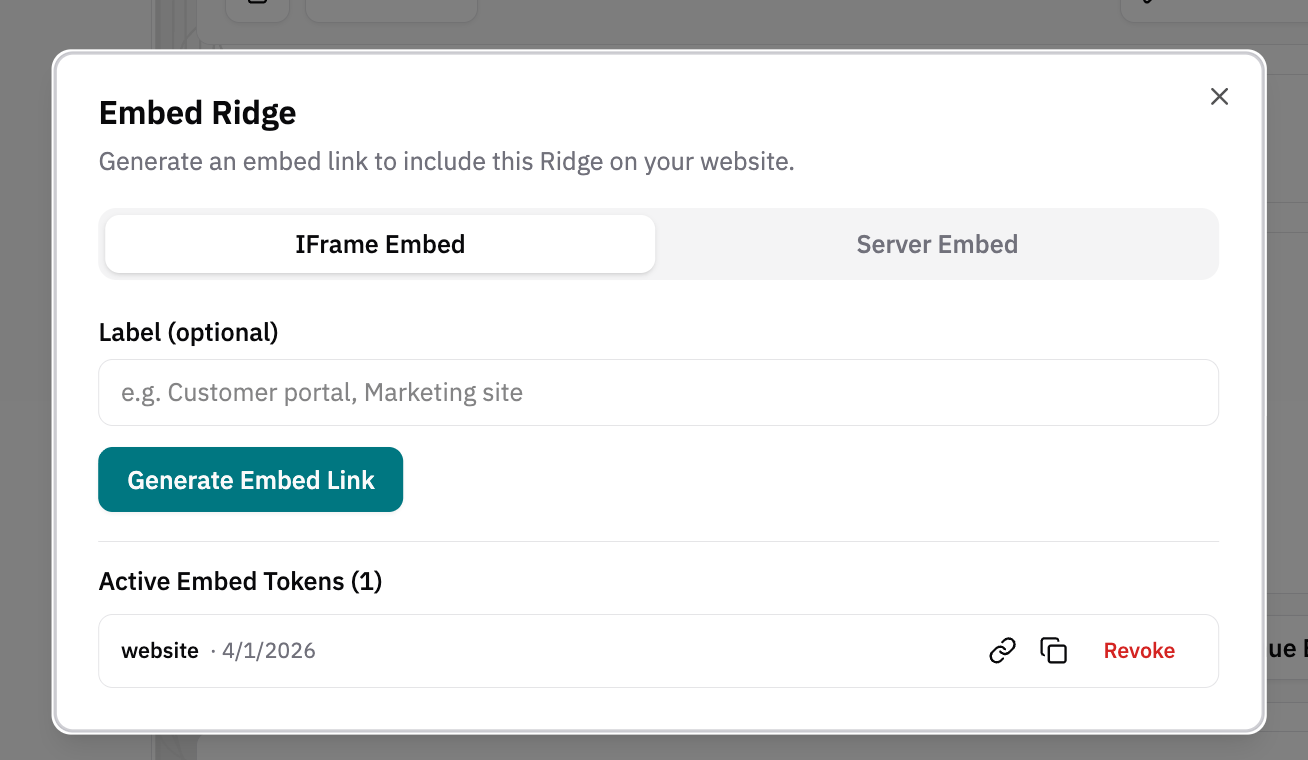
iFrame embedding is the simplest approach. Just generate an embed token, copy the iFrame link, and put that code in your website code, wherever you want your embedded visualization. Ridge will track the embed tokens for each Ridge so you can reuse or delete them.
Server-based embedding has several advantages:
1. Uses JWT to automatically authenticate your end-users when they navigate to an embedded Ridge.
2. Allows you partition data by whatever field you choose (usually account ID or customer ID). This means data stays secure and every end-user sees only their own data.
3. Allows you to inherit theming from the embedded page.
Both are found in the Ridges page when you select a Ridge. Server-based embedding requires some server-side code and usually takes customers less than 30 minutes to set up.