Why Tableau customers are choosing Ridge AI
Better embedded performance at a fraction of the cost, even on millions of records. A great user experience with easy deployment. No more "Tab-slow."
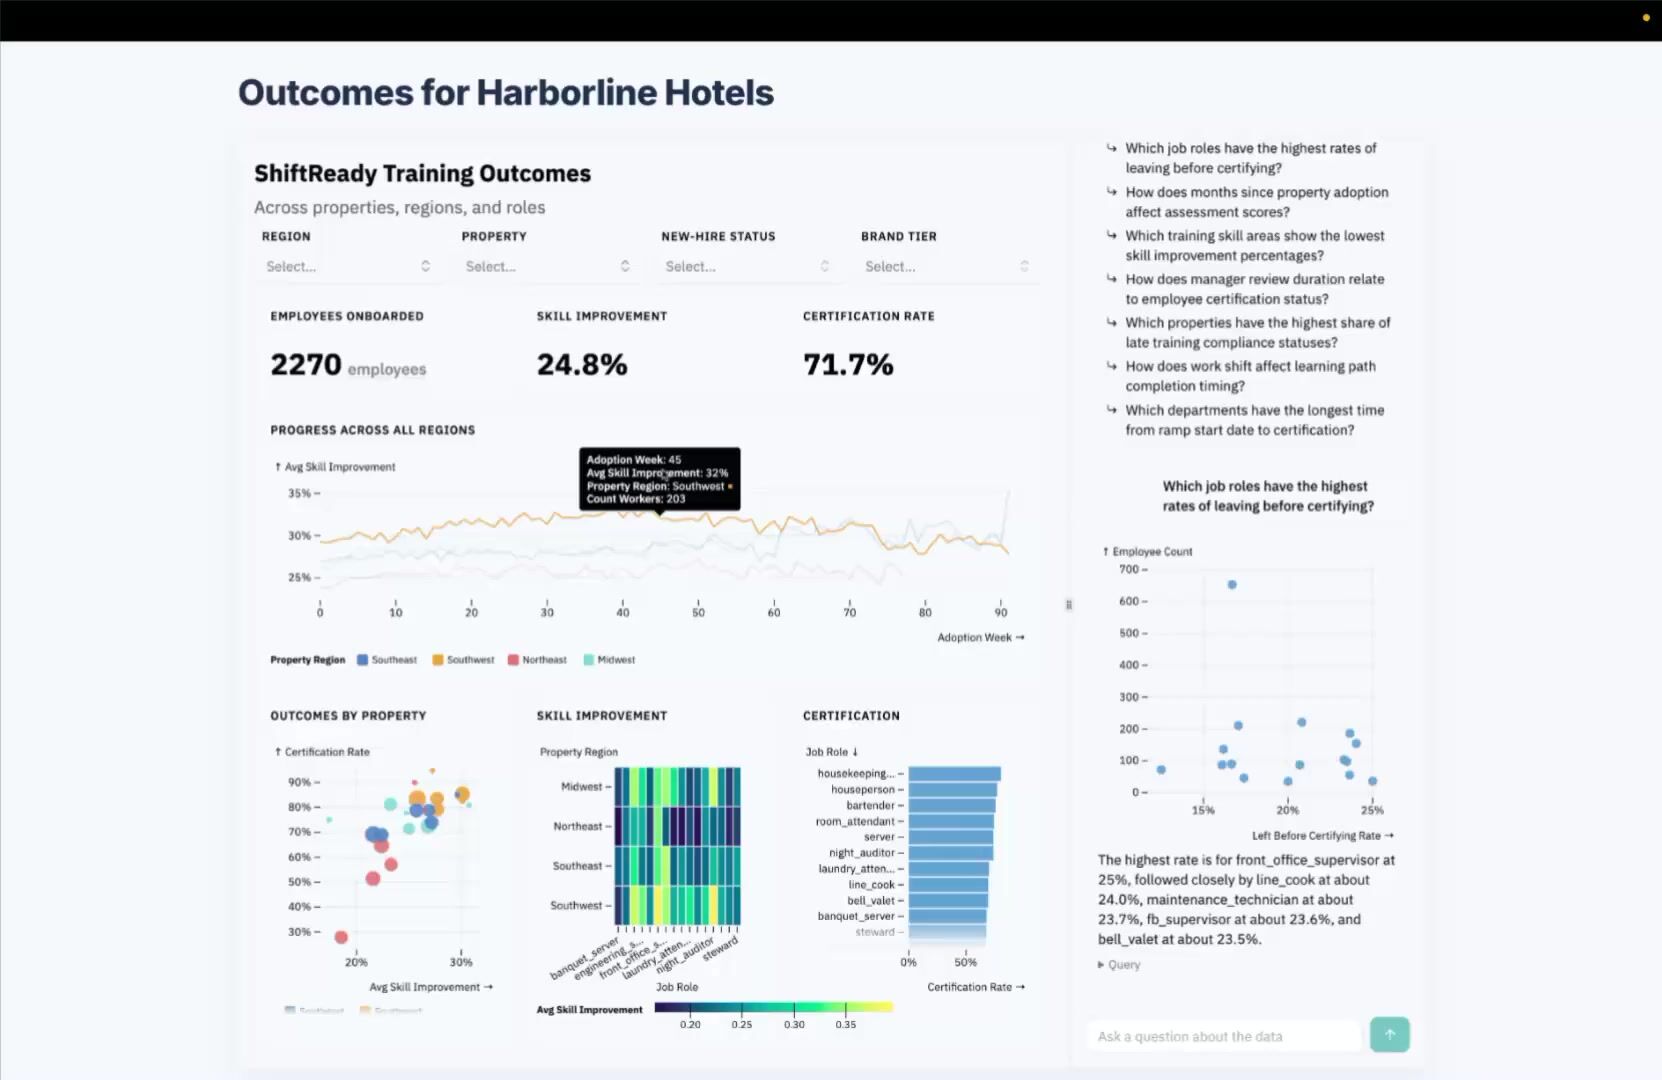
A modern approach to embedded analytics: AI-native, interactive, & governed.

Filter, drill-down, even link between the dashboard and data agent. It's always fast. Customers explore their data instead of waiting on it.

Ridge can build from an image, so it's easy to migrate an existing dashboard or build from a Claude artifact. Or start from scratch in Ridge. Either way, it's fast and the result is beautiful.

Each Ridge covers one use case with no per-viewer fees. Get started for under $10k a year, including embedding and customer partitioning.
Tableau Embedded vs Ridge AI
How the three approaches compare on the questions product teams ask most. Tableau details come from Tableau's own documentation as of November 2026.
Category
Building in-house
Tableau Embedded
Ridge AI
Speed for your customers
Depends on your team and infrastructure
Varies with data size, extracts and server capacity
Sub-second, even on millions of rows
Pricing
Ongoing engineering cost
Quote-based. Viewers licensed by usage or capacity, authors per user
Per use case. Standard Ridge is $9,600 a year; free plan to start
Time to first dashboard
Months
Weeks of design, embedding and auth work
Minutes, in Claude or in Ridge
Who builds it
Your engineers
Your BI developers
Anyone on your team, with the Build Agent or Claude
Asking questions in plain English
Another project to build
Separate add-on features with limited abilities
Built in: every Ridge comes with an Explore Agent
Analytics that feel like part of your product
Embedded analytics means dashboards inside your own product, built for your customers. They should look and behave like the rest of your app. Our guide, Embedded Analytics in the AI Era, explains what a modern platform needs. Here's how Ridge delivers it.
An Embed SDK that talks to your app
The Ridge Embed SDK lets your application set filters, read and write dashboard state, and listen for events. A Ridge can follow your product's navigation and context like a native feature. The Embed SDK supports iFrame and Javascript embedding with JWT.
Theming that matches your design system
Set light and dark UI colors, corner radius and chart palettes for each embed. The JavaScript embed renders in a shadow root, so your app's CSS can't break the dashboard, and the dashboard can't break your app.
Build in Claude with the Ridge MCP
The hosted Ridge MCP server connects Claude or ChatGPT to Ridge. In one chat you can upload a CSV, JSON or Parquet dataset, have the Build Agent create a Ridge, ask for changes, publish it and get the embed code. There's nothing to install.
Built by analytics veterans
Co-founder and CEO Ellie Fields spent 12 years at Tableau and helped build Tableau Public and Tableau Online. Co-founder Jeff Heer co-created D3.js, Vega and Mosaic. Ridge applies the best practices they've refined for decades so your analytics are interactive and understandable.
What independent analysts found
"The performance was insane. Fastest BI interface I've ever seen."
Ryan Dolley, analyst and host of SuperDataBros · September 24, 2026
Ryan, a former VP of Product Strategy at GoodData, tested Ridge live. A million rows filtered instantly in the browser, and he built an embedded analytics app on his own site. Ryan notes the review was not sponsored.
"Ridge also addresses the build-versus-buy question product teams now face as AI coding tools make custom dashboards look easy. The hard part of customer analytics is tenancy, validation, and upkeep."
Herb Blecher of Enterprise Management Associates (EMA) tested Ridge hands-on. He measured dashboard interaction under 1 second on datasets up to 3 million records, computed in the browser.
Trusted by Data Leaders
Hear how founders, product executives, and data leaders are using Ridge to transform complex data into interactive experiences.
"Sub-second buttery interactions."

"Ok, this is really f***ing cool."

"The performance was insane."

"This is what I want to see built for data in the age of AI."

"Being able to ask free-form questions in the data agent makes dashboards vastly more flexible and useful."

Questions Tableau teams ask about Ridge
Is Ridge a replacement for Tableau?
Ridge replaces Tableau for broad, shared use cases like customer-facing, embedded analytics. Many teams keep Tableau or move to AI-native analytics for ad-hoc analytics, and move shared analytics to Ridge one at a time. If you need a broad internal BI estate and have many Tableau experts who can author thier own analytics, Tableau remains a strong fit.
How do I move an existing Tableau dashboard to Ridge?
Give the Build Agent a screenshot of the dashboard. Connect to the dataset behind it, and Ridge rebuilds the layout in minutes. You refine it in plain English. Ridge works best on a clean, analysis-ready table.
What if I'm moving to AI-native analytics like Claude?
AI-native analytics are great for personal, one-time analytics or small sharing scenarios. Claude and other assistants are also great for prototyping. You can build anywhere, then give the Build Agent a screenshot of the dashboard. Connect to the source data and you're ready to go. Ridge will even surface any questionable assumptions made by AI, and take your data back to the row level instead of whatever aggregation your AI assistant chose.
How fast is Ridge on large datasets?
Ridge responds in under a second on datasets up to about 3 million rows, because it computes in the browser instead of waiting on a server. EMA measured this in its October 2026 Impact Brief, and Ryan Dolley filtered a million rows live.
How much does Ridge cost compared with Tableau Embedded?
Ridge prices each use case, not each viewer. Standard Ridge is $9,600 a year and includes embedding and partitioning for up to 1,000 customers and 10,000 monthly views. Solo Ridge is $4,800 a year without partitioning, and a free plan lets you build and test. See Ridge pricing. Tableau doesn't publish embedded prices. It licenses viewers by usage or capacity and authors per user.
How long does it take to embed a Ridge?
You can build a first Ridge in minutes. Embedding is an iframe or a few lines of JavaScript, plus a token endpoint on your server. The quickstart walks through both.
What are Ridge's limits?
Ridge is built for focused, customer-facing use cases, not a sprawling BI estate. In-browser computation works best up to a few million rows per customer. Larger data should be aggregated into an analysis-ready table first.
What happens after I book a demo?
You get a 30-minute call with the founding team. Bring a dataset or a screenshot of a Tableau dashboard, and we'll build a Ridge from it on the call.
Last updated November 14, 2026 · Reviewed by Ellie Fields, co-founder and CEO (team)
Explore a live embedded Ridge
This is a real Ridge, embedded with an iframe and running on more than 220,000 rows of demo product-adoption data. Filter it and click into the charts to see how it responds.
More examples in the gallery.

Secure by design
Ridge integrates with the security infrastructure you already use — OAuth2 for authentication, JWT for tenant scoping, and row-level isolation per customer. Data is encrypted in transit and credentials are stored securely. Ridge is SOC 2 Type II compliant.