

A few weeks ago I spoke at the Local-First Conference in Berlin. The conference brought together roughly 350 people interested in software that prioritizes data ownership, user agency, and the ability of end users to do more with their own digital tools.
Our talk “Mosaic: Scalable Interactive Data Visualization for the Browser” explored what those principles could mean for analytics. Dominik Moritz of Carnegie Mellon University, my fellow Mosaic creator, co-authored the talk.
The basic idea of local-first software is provocative: a generation of data products are built on the assumption that serious analytics must happen somewhere else. The user clicks a filter, a request travels to a remote server, a database runs a query, and eventually the result travels back.
Mosaic asks how much of that work can happen closer to the person asking the question—and what becomes possible when it does.
Here are seven ideas from the talk.
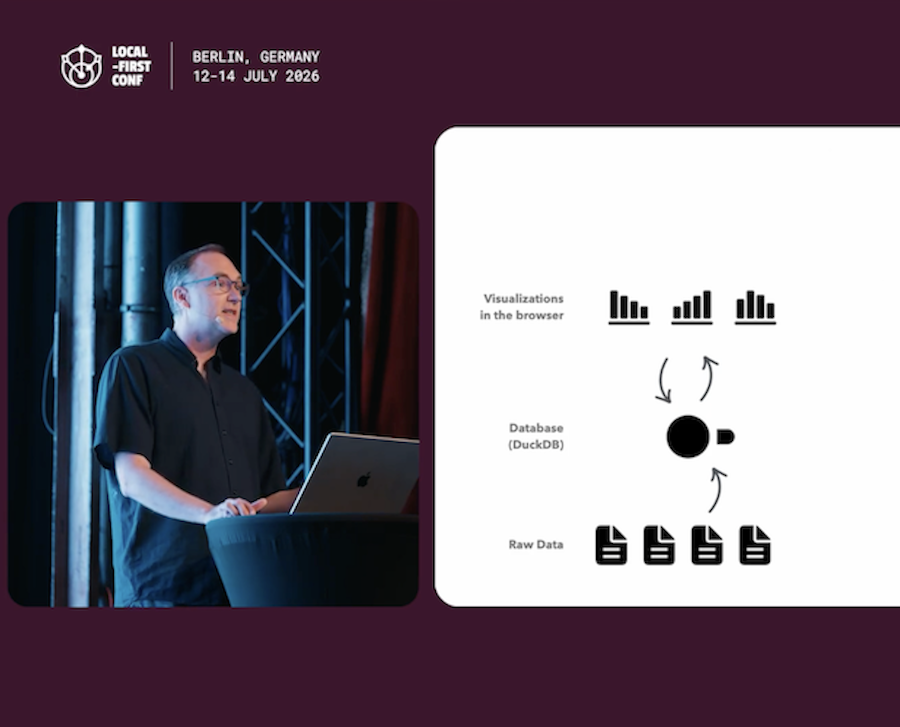
1. “Faster than you think”
First we challenged a deeply embedded assumption about modern analytics: that large-scale analysis necessarily means sending every question to a cloud data warehouse.
Modern laptops are remarkably capable analytical machines. Technologies such as WebAssembly and DuckDB even make it possible to run a high-performance analytical database directly inside a web browser. Mosaic builds on these capabilities to coordinate the data, queries, visualizations, and interactions around it.
The result is not merely a faster version of an old dashboard. It is a different architecture for how people interact with data.
2. “Billions of records”
Local-first does not have to mean small data.
The Mosaic research includes an interface for exploring all 1.8 billion stars in the Gaia star catalog. Instead of passing every individual record to every chart, Mosaic pushes aggregation and filtering into a local DuckDB instance and returns the results each view needs. Moreover, interactive queries are optimized by preaggregating results at a granularity that matches user inputs (clicked points, brushed regions, etc.). Mosaic’s published benchmarks show order-of-magnitude performance improvements over existing browser-based visualization systems.
That distinction matters. Mosaic is not trying to make a browser render billions of marks simultaneously. It gives interactive components a shared way to express their data needs, then coordinates multiple queries for efficient ways to answer them.
3. “Entirely on your machine”
Running analytics locally changes more than performance – it can also reduce network round trips, limit unnecessary movement of data, and let applications continue to provide rich interaction without asking a remote service to recompute every small change. Mosaic can connect to DuckDB running inside the browser through WebAssembly, as well as to local or remote databases when the workload calls for them.
In other words, Mosaic is not a rigid browser-only system. It provides a common architecture that can place computation in the browser, on a server or across both. It’s all about doing the work in the place that creates the best experience.
4. “No cloud”
For many applications, eliminating a server round trip from an interaction can produce an enormous improvement. A user can select a range, change a filter, or investigate a segment without waiting for a new request to travel through the entire cloud stack.
But “no cloud” does not mean “the cloud is obsolete.” Large source datasets may still live in Snowflake, Databricks, BigQuery or another analytical platform. Expensive queries may still need server-side execution. Mosaic’s goal is to make local, remote, and hybrid execution part of a single interactive system.
5. “Declarative queries”
A conventional dashboard often tightly couples its charts, data-processing logic, and interactions. Each component may contain custom code describing what to query, when to query it, and how it should respond when another component changes.
Mosaic separates those concerns. Charts, tables, menus, search boxes, and other components publish their data requirements as declarative queries. A central coordinator collects those requests, sends the necessary work to the database, and returns results to the clients that need them.
Selections are shared as first-class objects rather than being trapped inside one charting library. That allows a selection made in one component to filter another chart, update a table, or change the context available to a different analytical interface.
It also allows Mosaic to optimize across the full application. The system can consolidate queries, cache results, and automatically materialize pre-aggregated views for interactions that need especially low latency.
6. “Speed of human thought”
Performance is sometimes treated as an infrastructure metric. For interactive analytics, it directly affects what people are able to discover. When every selection requires a long pause, users make fewer selections. They test fewer hypotheses. They stop following interesting paths through the data.
Mosaic’s goal is not simply to make a predetermined dashboard load quickly. It is to preserve fluidity as the user explores: selecting, filtering, comparing, and asking the next question that occurs to them. Mosaic’s selection optimizations use techniques such as automatic pre-aggregation to produce orders-of-magnitude latency improvements for linked filtering across large datasets.
That is what “the speed of human thought” means in practice: keeping the system responsive enough that the interface does not interrupt the analytical conversation.
From Mosaic to Ridge AI
Mosaic is foundational to what we’re building at Ridge AI. Mosaic is the open-source layer that coordinates the visualizations, data and interactions in a Ridge – a combined dashboard and Explore Agent. It allows computation to happen in the browser, keeps charts and filters synchronized, and makes the dashboard feel responsive even when users are exploring substantial datasets.
Ridge builds a product experience around that architecture. Each Ridge combines a dashboard with a paired Explore Agent. The dashboard provides a structured, visual understanding of the data. The agent lets a user ask the follow-up questions that cannot all be anticipated and placed on a dashboard in advance.
Because the two experiences share the same data and context, a user can make a selection visually and continue the investigation through natural language – or ask a question and receive an answer that can be visualized and explored further.
This is where technical architecture becomes a product capability. Fast local computation is not an end in itself. It supports a more direct and fluid conversation between people and their data.
A different architecture for analytics
The cloud remains an essential part of the modern data stack. But it does not need to sit in the critical path of every interaction.
Mosaic shows what becomes possible when the browser is treated as a capable analytical environment, visualizations communicate through a shared architecture, and computation can move between local and remote systems according to the needs of the application.
The result is analytics that are faster, more composable, and closer to the user.
Watch the complete Local-First Conference talk, or explore the Ridge AI Gallery or the Mosaic project and examples.