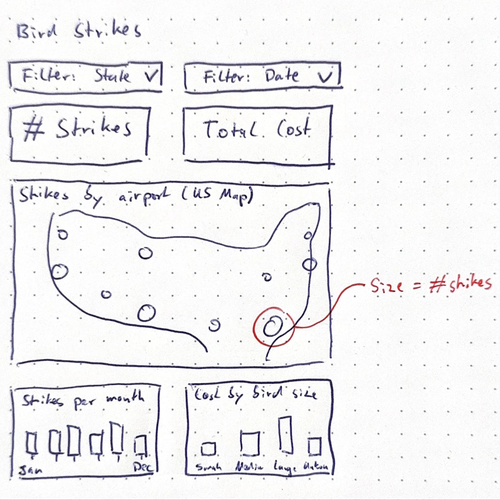
Since we launched Build Agent 2 in August, we've had a lot of updates on quality like better layouts and color, direct manipulation and in-place prompting, and building dashboards from an image. Quality is paramount but speed matters too. Visual analysis is iterative, and every time you wait, you lose a bit of the thread you were pulling on. With Claude, it can be frustrating and slow to prompt all the edits that you want. Bring the dashboard into Ridge and you’ll find the initial build and editing much faster. You also get some of the direct interaction capabilities like rearranging layout and editing text directly that Ridge gives you.
75 years of tornadoes
With the latest rounds of updates, we made progress on getting closer to speed of thought. Building the first draft of a dashboard is now 3.5x faster. The Build Agent typically finishes in just under a minute (median). Subsequent chart edits got 2-5x faster, depending on whether the query has to change or just the visuals. Changing only the visuals, like the chart type or the colors, typically went from about 13 seconds to 2 (median). Edits that also need a new query went from about 30 seconds to 13.
The improvements were driven by the following engineering work and better models:
- A new chart agent that operates on a reduced, flat, enumerable schema
- Much more of the work runs in parallel
- Fast decision models handle the many little decisions along the way
On quality, I'm most excited about layouts. The agent already put a lot of care into composing the first dashboard. Now, when you ask for more charts later, the agent places them where they fit best in the existing layout. When adding multiple new charts, the agent now rethinks the information hierarchy and layout. Together this ensures that you don’t silently converge to an unrelated pile of charts but remain focused on a data story.
The videos show four builds in real time with only the typing and mouse movement sped up. One other new feature besides speed is that the Build Agent can now also directly answer data questions. This is super useful for verifying patterns you see in the charts. For instance, in the first video on tornadoes, I wondered whether the rise in recorded tornadoes since 1950 mostly comes from better tracking of weak ones or is explained otherwise (maybe climate change). The agent checked: weak tornadoes (EF 0-1) account for the rise, while strong ones haven't increased. It was also upfront that the data alone can't prove why 🌪️
Try it yourself for free with your own data at app.ridgedata.ai.
Happy exploring! 📊